
Inverted Yield curve – “What the *?%%*?”
Yesterday the US stock market took it on the chin with the major indices were all down in the 2.5% to 3.0% range. What was the cause of the selloff? If you listened to the nightly news you heard talk of the inverted yield curve and how it is a “flashing red signal” for an imminent recession. So, what actually is an inverted yield curve? Simply put it is when short term yields are higher than longer term yields and this is seen as an indicator of a slowing economy.
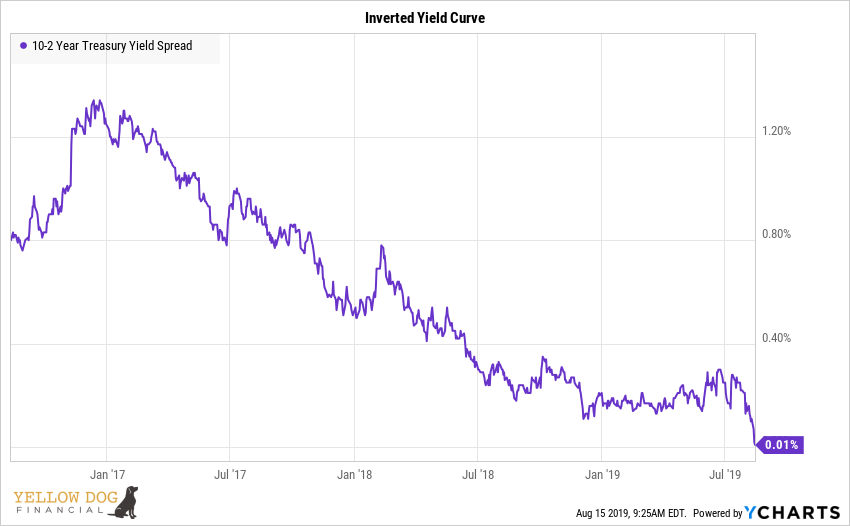
The above chart shows the spread between the 10 year treasury yield and the 2 year treasury yield. As you can see, yields are currently flat so investors in 2 year treasuries are getting paid the same as those in 10 year treasuries. This is not a normal situation as you should receive more yield for a longer maturity.
The question for long-term investors is what does this mean for their stock portfolio. Like most indicators it is hardly conclusive, and the best course of action is to maintain discipline and stick to your plan. If you don’t have a plan you need to get one.
If you want to read in more detail (a little ‘Inside baseball’ here) Dimensional Fund Advisors has provided me with the following article that looks at this indicator and stock market performance.
The Flat out Truth
Here is the key takeaway from the article:
In 10 out of 14 cases of inversion, local investors would have had positive returns investing in their home markets after 36 months. This is not much less than the historical experience of these markets over the same time frame, regardless of the shape of the yield curve. These results show that it is difficult to predict the timing and direction of equity market moves following a yield curve inversion.
If you have questions or would like to discuss your financial situation, let’s talk.
Bill Nickles


